Estimated based on historic U.S. Bureau of Justice Statistics Data
How It’s Calculated
Our calculation is primarily based on Bureau of Justice statistics from their “Household Burglary, 1994-2011” report.
We utilize our own assumptions to combine their key data points and revise the numbers from that earlier in-depth report to approximate for more recent general trends in crime. Of course, these historic estimations should not be relied upon for making important security decisions, but instead to promote general awareness of past crime trends. See more detail below on how we estimated these numbers.
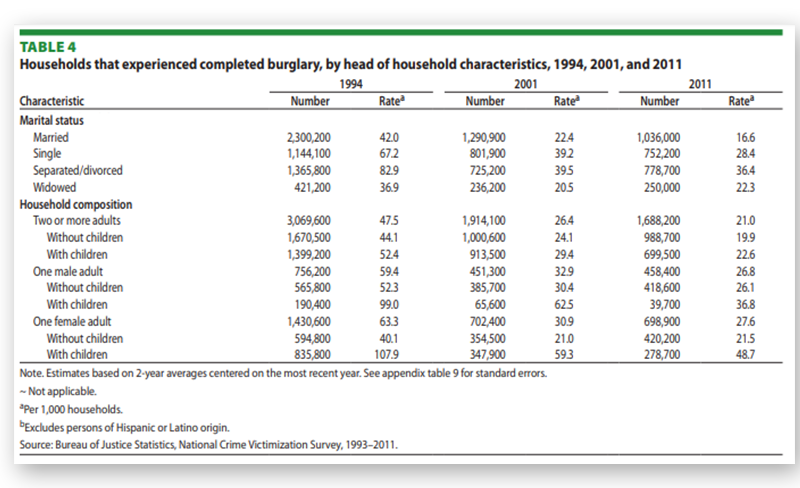
We use demographic data – who lives in the home, and family status – as the starting base rate risk as it provides the widest range and most robust data points.
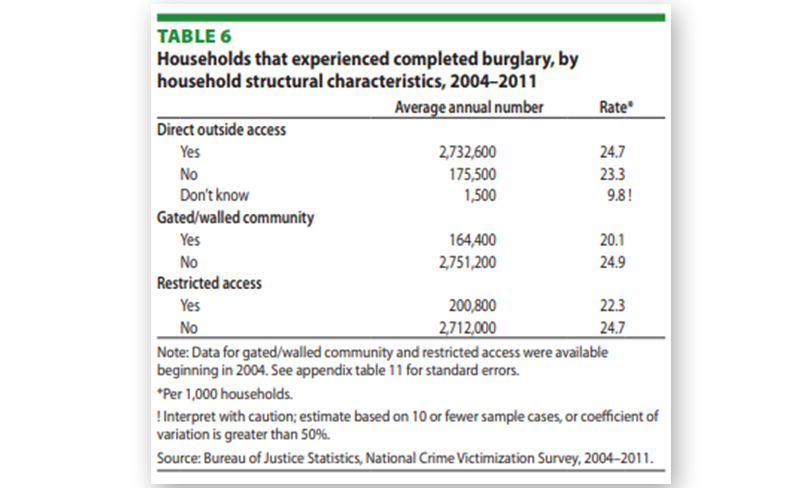
Outside Access
We then adjust the previous base rate based on adjustments for security measures, such as gated communities. To many people’s surprise, these factors only confer limited benefits.
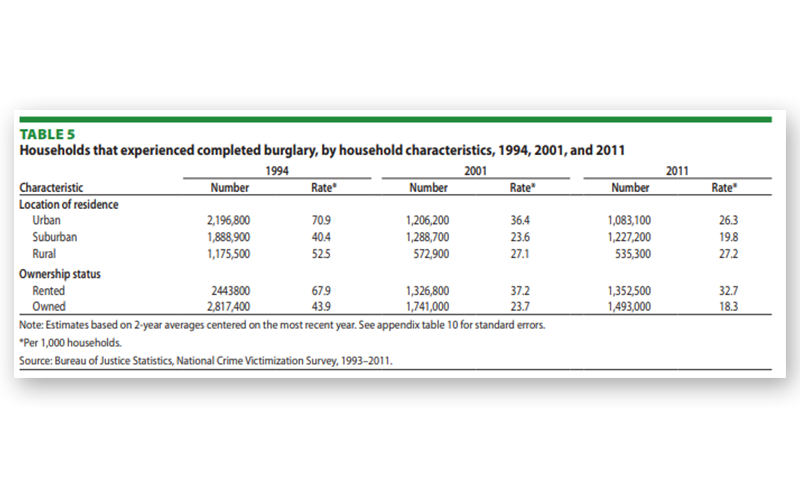
Location & Ownership
Finally, your location affects your risk as well, from dense city living to expansive country living. The correlation between risk and renting versus owning is particulary high.
There are three types of events that the BJS considers a burglary:
Attempted Forcible Entry – this is where the attacker works to damage some entry point (window, door, etc) to allow access into the home, but flee before being successful.
Completed Unlawful Entry – this is where the attacker illegally enters a home but does not use force to do so, such as entering through an unlocked door. For example, this is how the 2020 kidnap attempt on Joe Montana’s daughter took place.
Completed Forcible Entry – Here forced entry is used (such as breaking open a window) which successfully allows the burglar to gain access to the inside of the home.
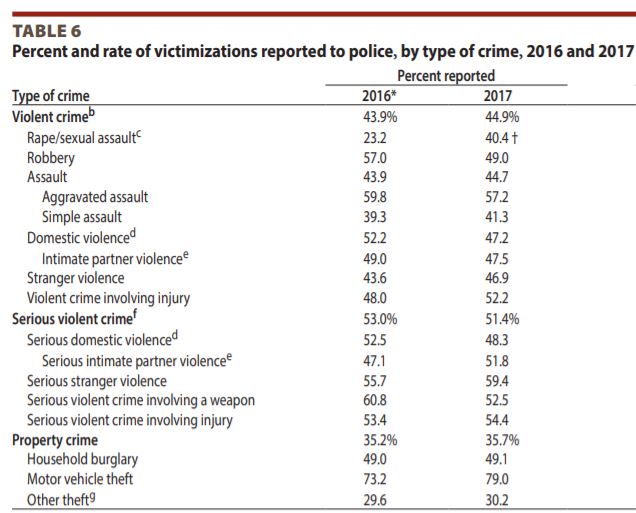
The chart compiled by BJS which we used for our calculator focused only on the completed forcible and unlawful entry, and ignored the only-attempted attacks. However, since we are interested in repelling attacks, we increased the odds by roughly 18% to compensate for this, as per the chart to the right.
Despite what you may be lead to believe from the prevalence of news events and social media anecdotes, crime is not on the rise and in fact has made tremendous improvement in the past few decades in America.
This decrease is really across the board, from property crime to violent crime.
The US Department of Justice releases most of their general reports yearly or semi-yearly. However, unfortunately, their in-depth, granular look at residential burglary was last released in 2011.
Therefore, a pure look at the base rates in that report would overestimate the current risk. To adjust for this, we looked at the general trends in household burglary as a whole, and took our best stab at revising the granular numbers. We felt a 38% reduction was a decent estimate, and have baked this into our calculator.
Others who have researched the topic thoroughly may notice that there are actually two government agencies that tabulate USA crimes consistently, but they result in vary different numbers.
The first one is the Federal Bureau of Investigation (FBI) Uniform Crime Reporting (UCR) program.
The second is the Dept. of Justice / Bureau of Justice Statistics (BJS) National Crime Victimization Survey (NCVS). This is the data we use.
UCR data is almost always lower. This is for a simple reason. The FBI’s data only covers crimes that were officially reported to police.
Unfortunately a massive amount of crime is never reported to police. Since our focus is on protecting homeowners we therefore use the rigorously collected data from the Department of Justice’s NCVS.
Our team provides safe room and secure home solutions to clients around the USA. 1-844-656-FORT
Fortified Estate, LLC
1900 Jay Ell Dr.
Richardson, TX 75081